Is Grafana Loki Right for Your Kubernetes Stack?
If you’re a developer or DevOps engineer managing a Kubernetes environment, the quest for the perfect log aggregation system is a familiar one. When you’re already leveraging the power of Prometheus and Grafana for metrics, Grafana Loki often appears as a compelling, native-feeling option. But is it the right choice for you?
Yahia Raslan
8/19/20244 min read
Loki is designed with a specific philosophy : be cost-effective, highly scalable, and integrate seamlessly with your existing stack. Unlike other systems, it doesn’t index the full content of your logs. Instead, it indexes a small set of metadata labels for each log stream. This core design choice leads to both its greatest strengths and its most significant limitations.
Let’s dive into what makes Loki special and the critical considerations you need to weigh before committing.
The Allure of Loki: Why It’s Gaining Traction
1. Seamless Grafana & Prometheus Integration
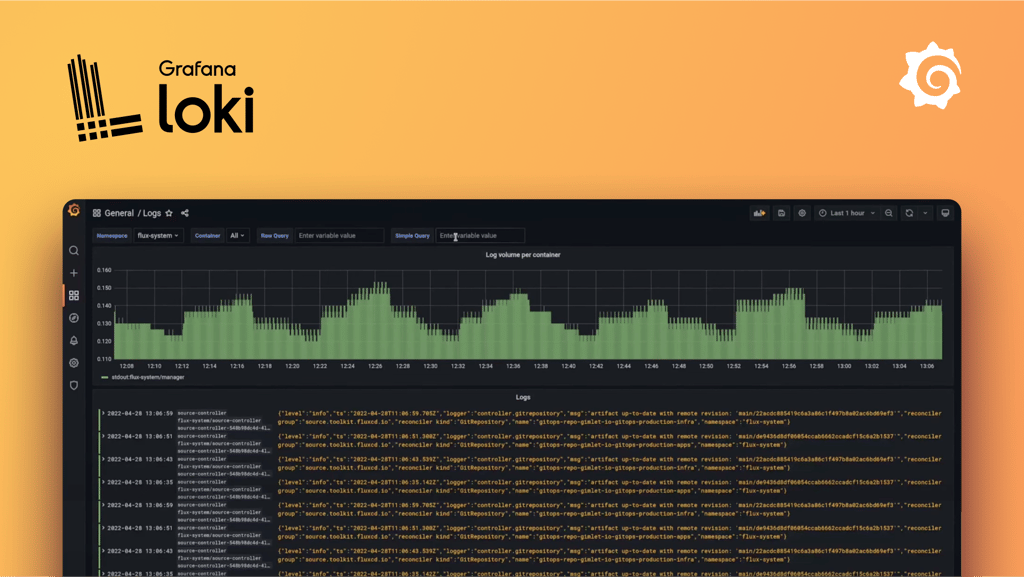
This is arguably Loki’s killer feature. If your team lives in Grafana dashboards, Loki feels like a natural extension. It allows you to create a single pane of glass for your observability data. You can correlate metrics from Prometheus with logs from Loki in the same dashboard, jumping from a spike in a metric graph directly to the relevant logs from that exact moment. Add Grafana Tempo to the mix, and you have the observability trifecta — metrics, logs, and traces — all in one unified interface.
2. Built for Cost-Effective, Cloud-Native Scale
Loki’s architecture is a perfect match for the modern infrastructure landscape.
Horizontally-Scalable: Its microservices-based design allows it to scale out effortlessly to handle massive log volumes, making it ideal for large Kubernetes deployments.
S3-Compatible Storage: Loki uses object storage (like AWS S3, GCS, or MinIO) for its primary data store. This is significantly cheaper than the block storage required by many other logging systems, drastically reducing your operational costs.
3. A Thriving Ecosystem and Modern Standards
When adopting an open-source tool, community and support are paramount. Loki is backed by Grafana Labs and boasts a large, active community, ensuring robust documentation, frequent updates, and a wealth of shared knowledge. Furthermore, its native support for OpenTelemetry (OTEL) ingestion positions it as a forward-looking choice, ready for the future of observability standards.
4. Built-in Operational Safeguards
Loki comes with practical features designed for real-world production environments.
Multi-Tenancy: Loki’s multi-tenant architecture allows you to completely isolate log data between different teams, applications, or environments using a simple HTTP header (X-Scope-OrgID). This is crucial for security and organization in large companies.
Bandwidth Limiting: It includes built-in rate limiting to protect your system from sudden, massive bursts of logs (a “log storm”) from a misbehaving application. This prevents the entire system from crashing and potentially losing valuable data.
While Loki’s advantages are clear, it’s not a universal solution. Its design requires certain trade-offs that may be deal-breakers depending on your needs.
The Caveats: What to Consider Before Committing
1. It Is Not a Full-Text Search Engine
This is the most critical point to understand. Systems like OpenSearch or Elasticsearch index everything, allowing you to run complex, free-text searches across your entire log content. Loki only indexes labels. Searching is done in two stages:
Use Loki’s query language (LogQL) to filter and select log streams based on their labels (e.g., {job="api", namespace="prod"}). This is extremely fast.
Optionally filter the content of the selected log streams using grep-like commands (e.g., |= "error" or |~ "status=5[0-9]{2}"). This stage scans the raw log data and is slower.
If your primary use case involves exploratory searching or finding needles in a haystack without knowing which labels to check first, Loki’s search capabilities will feel restrictive.
2. Your Success Hinges on Label Discipline
Because searching relies on labels, good label hygiene is non-negotiable. If your logs lack consistent, meaningful labels, finding the information you need will be difficult and slow. This puts the onus on your team to establish and enforce a clear labeling strategy for all log sources. In complex scenarios, defining and managing these labels can become a tricky task in itself.
3. Increased Operational Overhead
Loki’s simplicity comes at the cost of some “batteries-not-included” features.
Authentication: Loki has no built-in authentication or authorization system. You are expected to place it behind a proxy like Nginx or an authentication gateway to secure it, adding another component to manage.
No Kubernetes Operator: As of now, there is no official Kubernetes Operator for Loki. Deployment and management rely on Helm charts, which, while powerful, may not offer the automated lifecycle management that an operator provides.
Manual Tenant Configuration: While multi-tenancy is a feature, setting it up in Grafana requires manual work. For each tenant, you must add a new Loki data source in Grafana and potentially create separate Grafana Organizations to maintain isolation.
No Native Reporting: Loki itself does not have a reporting feature. While you can build powerful dashboards in Grafana that serve a similar purpose, it’s not an out-of-the-box reporting solution.
4. Open Source
As open source can be a big advantage and disadvantage at the same time as you may hit an issue which is being opened for a while or unclear/old Documentation somewhere but community should be somehow assurance that your questions will be answered.
The Verdict: Is Loki for You?
Loki is a fantastic, highly efficient logging system for the right team and use case. It is purpose-built to solve the log aggregation problem at scale without breaking the bank.
You should seriously consider Loki if:
You are already heavily invested in the Prometheus and Grafana ecosystem.
Your primary goal is to correlate logs with metrics and traces for debugging.
Cost-effectiveness and scalability are your top priorities.
Your team is comfortable with a label-first approach to querying logs.
You might want to look at other solutions if:
You require powerful, unpredictable full-text search capabilities on raw log content.
You prefer a fully managed, all-in-one solution with built-in authentication and reporting.
You don’t have a disciplined strategy for applying consistent labels to your logs.
Ultimately, Loki makes a deliberate trade-off: it sacrifices indexing power for incredible efficiency and cost savings. If that trade-off aligns with your observability strategy, you’ll find it to be a formidable and elegant solution.
What are your experiences with Loki? Let me know in the comments.
Innovation
Streamlining processes for optimal performance and efficiency.
Growth
Expertise
+31642016640
© 2025. All rights reserved.